The following media items used in this module are protected by the details of their copyrights. Please use the "copyright terms" link associated with each media item below for more information.
Click an image to view it at full size in a new browser window/tab.

credits:
Comet/NOAA
copyright terms:
COMET Standard Terms of Use
description:
Surface isobaric analysis of the tropical north Pacific at 00 UTC 7 May 2009
|

credits:
NOAA/NWS
copyright terms:
COMET Standard Terms of Use
description:
Verification of the GCPE calculated forecast error compared to the actual track error of the corresponding forecast. This verification is done on a training dataset
|

credits:
NOAA
copyright terms:
COMET Standard Terms of Use
description:
Relative tracks of 1995 North Atlantic Hurricane Iris and Tropical Storm Karen as they undergo a Fujiwhara interaction with each other. Note how the direction of rotation changes from cyclonic to anticyclonic as Karen is eventually absorbed into Iris
|

credits:
US Navy NRL / NOAA / NASA
copyright terms:
COMET Standard Terms of Use
description:
CloudSat orbit and profile of clouds over the Caribbean on 23 Sep 2008
|

credits:
NOAA
copyright terms:
COMET Standard Terms of Use
description:
200 hPa streamline analysis at showing tropical upper tropospheric trough (a) 0000 UTC 6 May and (b) 0000 7 May 2001; visible satellite images at (c) 1245 UTC and (d) 2045 UTC 6 May 2001.
|

credits:
NOAA
copyright terms:
COMET Standard Terms of Use
description:
Time-Height plot of relative humidity (shaded) and wind velocity over Niamey, Niger from 22 May to 3 June 2009.
|

credits:
Comet/NOAA
copyright terms:
COMET Standard Terms of Use
description:
250 hPa wind barbs (kts) of the tropical west Pacific at 00 UTC 7 May 2009
|

credits:
Comet/NOAA
copyright terms:
COMET Standard Terms of Use
description:
Surface winds of the tropical north Pacific at 00 UTC 7 May 2009
|

credits:
Comet/NOAA
copyright terms:
COMET Standard Terms of Use
description:
Surface winds and satellite IR of the tropical north Pacific at 00 UTC 7 May 2009
|

credits:
Comet/NOAA
copyright terms:
COMET Standard Terms of Use
description:
Streamlines, IR, isotachs, and wind of the tropical north Pacific at 00 UTC 7 May 2009
|

credits:
Comet/NOAA
copyright terms:
COMET Standard Terms of Use
description:
Streamlines, isotachs, wind barbs of the tropical north Pacific at 00 UTC 7 May 2009
|

credits:
Comet/NOAA
copyright terms:
COMET Standard Terms of Use
description:
streamlines, isotachs, and satellite water vapor image of tropical west Pacific at 00 UTC 7 May 2009
|
|
|

credits:
Australian Bureau of Meteorology
copyright terms:
COMET Standard Terms of Use
description:
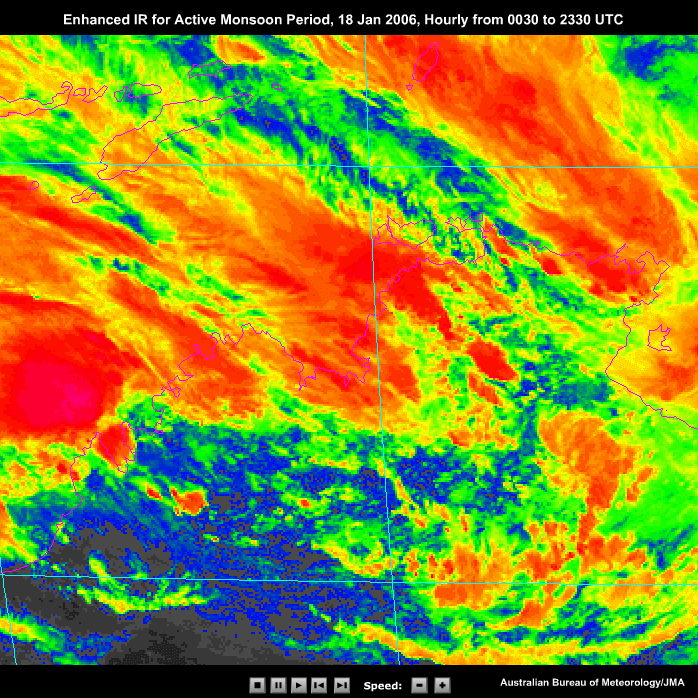
IR satellite image, MSLP and 900 hPa vorticity, 2300 UTC sounding, radar image of active phase convection
|

credits:
WMO Secretariat
copyright terms:
COMET Standard Terms of Use
description:
Map of stations color coded according to reporting percentage. Need copyrights permission from WMO
|
|
|
|
|
|

credits:
NOAA/NWS
copyright terms:
COMET Standard Terms of Use
description:
Example of weather analysis systems: AWIPS used by the US NWS
|

credits:
NOAA/NWS
copyright terms:
COMET Standard Terms of Use
description:
Base velocity image of Hurricane Rita, September 2005. Green indicates movement towards the radar and red indicates movement away from the radar. The light orange arrow shows general motion about the eye
|

credits:
Australian Bureau of Meteorology
copyright terms:
COMET Standard Terms of Use
description:
?Classic supercell low-level radar signature and radar cross section of the bounded weak echo region (BWER).
|

credits:
Australian Bureau of Meteorology
copyright terms:
COMET Standard Terms of Use
description:
A radar reflectivity image of a squall line approaching Darwin.
|

credits:
ncep data /comet
copyright terms:
COMET Standard Terms of Use
description:
Box and Whisker diagram showing the ensemble median, maximum, minimum, and two middle quartiles of a forecast variable (in this case, 2 m temperature).
|
|
|

credits:
Australian Bureau of Meteorology/JMA
copyright terms:
COMET Standard Terms of Use
description:
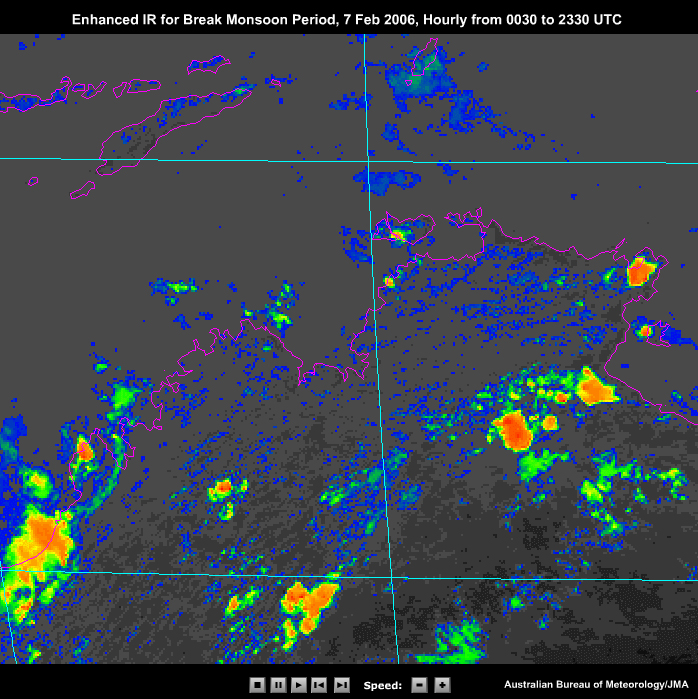
(a) An IR satellite image for 1700 LST, (b) Bureau of Meteorology model analysis of MSLP and 900 hPa vorticity, and (c) Darwin 0000 UTC sounding for an break phase of the monsoon on 7 February 2006. (d) Sample radar images of break phase convection.
|

credits:
NOAA / NDBC
copyright terms:
COMET Standard Terms of Use
description:
Typical observations from the global network of buoys. For real-time data, time series graphs are linked from the icons on the left.
|

credits:
NOAA / NDBC
copyright terms:
COMET Standard Terms of Use
description:
Typical observations from the global network of buoys. For real-time data, time series graphs are linked from the icons on the left.
|

credits:
Pope et. al. 2008
copyright terms:
COMET Standard Terms of Use
description:
Mean month values of CAPE, CIN and number of zero CAPE days for the 2300 UTC Darwin sounding. CAPE and CIN are calculated using the unmodified 2300 UTC surface values. The mean monthly CIN values exclude zero CAPE days.
|

credits:
Evans et al. 1991
copyright terms:
COMET Standard Terms of Use
description:
Steering flow resulting from climatological mean windfield (mass-weighted average between 850 and 200 hPa) with propagation for each latitude for the same TC added.
|

credits:
COMET/BOM/JMA/NOAA/NWS/OPC/TPC
copyright terms:
COMET Standard Terms of Use
description:
The automated analysis did not identify Tropical Storm Kujira. However, the storm is evident in the Unified Surface Analysis created by forecasters at the U.S. National Weather Service, Ocean Prediction Center, and Tropical Prediction Center.
Comparison between data output and surface analysis
|

credits:
NOAA/NCEP
copyright terms:
COMET Standard Terms of Use
description:
Supplemental observations added over an 18 hour period. Different shades indicate the age of the observations
|

credits:
Australian Bureau of Meteorology/JMA
copyright terms:
COMET Standard Terms of Use
description:
(a) An IR satellite image and (b) radar reflectivity image (right) for a break monsoon period. (c) Radar reflectivity images showing before and (d) after westward propagating convection encounters the seabreeze.
|

credits:
COMET
copyright terms:
COMET Standard Terms of Use
description:
processes to be accounted for in cumulus parameterization schemes
|

credits:
COMET
copyright terms:
COMET Standard Terms of Use
description:
Schematic of the centered difference approximation of the moisture advection equation.
|

credits:
Australian Bureau of Meteorology
copyright terms:
COMET Standard Terms of Use
description:
MSLP (contours) and 900 hPa vorticity (shading) (a) prior to monsoon onset on 6 December 2005 and (b) during an active monsoon phase, 23 March 2006 from the Bureau of Meteorology TXLAPS model
|

credits:
Australian Bureau of Meteorology
copyright terms:
COMET Standard Terms of Use
description:
Example of the calculation of the deterministic limit for a chosen weather system and forecast model.
|

credits:
Australian Bureau of Meteorology
copyright terms:
COMET Standard Terms of Use
description:
Infrared (IR) satellite imagery for Dili
|

credits:
Australian Bureau of Meteorology
copyright terms:
COMET Standard Terms of Use
description:
streamline/isotach analysis at gradient level (3000 feet above sea level)
|

credits:
University of Wyoming
copyright terms:
COMET Standard Terms of Use
description:
streamline/isotach analysis at gradient level (3000 feet above sea level)
|

credits:
Pope et. al., 2008
copyright terms:
COMET Standard Terms of Use
description:
The mean reflectivity versus height for the active monsoon (left), break monsoon (middle) and buildup environment (right) from Gunn Point Radar, Darwin.
|

credits:
UCAR
copyright terms:
COMET Standard Terms of Use
description:
Illustration of the rotational wind, divergent wind, and the velocity potential
|

credits:
Australian Bureau of Meteorology
copyright terms:
COMET Standard Terms of Use
description:
Doppler velocities and radar reflectivity (CAPPI and RHI) for a wet microburst
|

credits:
(c)The COMET Program/ Chapppel et. al. 1998
copyright terms:
COMET Standard Terms of Use
description:
a) Schematic and (b) sounding for a dry microburst.
|

credits:
(c)ECMWF
copyright terms:
COMET Standard Terms of Use
description:
Maps of point observations from the global network on 10 April 2009: (a) synoptic stations and ship reports, (b) upper air station reports, (c) buoy observations, (d) aircraft wind and temperature, (e) wind profiler reports, (f) temperature and humidity profiles from GPS radio occultation, (g) observations from citizen weather observers. The tropics are the bright areas bordered by ±30° latitude
|

credits:
ECMWF (top four panels), NASA/GSFC (bottom two panels)
copyright terms:
COMET Standard Terms of Use
description:
Geographic distribution of (a) geostationary satellite observations; (b) and (c) polar-orbiting satellite soundings; and (d) ocean surface scatterometer-derived winds. TRMM Microwave Imager (TMI) orbits are shown in (e) and (f). Each color represents the coverage of a single satellite. Observations in (b) and (c) represent vertical layers and area-averaged values. The tropics are marked by bright areas bordered by ±30° latitude.
|

credits:
Australian Bureau of Meteorology
copyright terms:
COMET Standard Terms of Use
description:
Example rank histogram for a 15 member ensemble
|

credits:
NOAA/NWS/NCEP EUMETSAT
copyright terms:
COMET Standard Terms of Use
description:
850 hPa analysis on 1-9 May 2002 (a-e) showing a mixed Rossby-gravity wave and equatorial (n=1) Rossby waves, the latter of which led to twin cyclogenesis. A Meteosat IR image of the twin tropical cyclones are shown in (f).
|

credits:
NOAA
copyright terms:
COMET Standard Terms of Use
description:
Satellite imagery of Hurricanes Floyd (1999) and Andrew (1992) as they approach Florida. At these times, the two storms had similar intensities, but evidently had very different size. Clearly the potential spatial extent of damage from Floyd greatly exceeds that for Andrew.
|

credits:
NOAA/NWS Melbourne
copyright terms:
COMET Standard Terms of Use
description:
Reflectivity and Doppler velocity signature of a deadly tornado in Central Florida in 23 February 1998 at 12:05 EST
|

credits:
Zilore Mumba / ACMAD
copyright terms:
COMET Standard Terms of Use
description:
ARPEGE-Tropique and United Kingdom Meteorological Office (UKMO) model forecasts of 850 hPa winds and humidity, synthetic forecast (valid at 1800 UTC 2 Nov 2006), and enhanced satellite IR image at 1745 UTC 2 Nov 2006.
|

credits:
US Navy/NRL
copyright terms:
COMET Standard Terms of Use
description:
Documentation of the frequency with which the actual storm track fell within the GCPE calculated forecast error circle. Recall that the 2007 season was not included in the initial GCPE training set
|

credits:
COMET
copyright terms:
COMET Standard Terms of Use
description:
A smooth and continuous temperature field and its corresponding grid point model representation.
|

credits:
NOAA
copyright terms:
COMET Standard Terms of Use
description:
GFDL operational grid nests and simulation of a mature hurricane showing the eyewall and rainband structure.
|

credits:
NOAA/GFDL
copyright terms:
COMET Standard Terms of Use
description:
GFDL simulation of the three-dimensional structure of the core of a mature hurricane.
|

credits:
NOAA
copyright terms:
COMET Standard Terms of Use
description:
Example of a three-dimensional global model grid (the Japanese GSM).
|

credits:
NOAA/NWS/NCEP EUMETSAT 2006
copyright terms:
COMET Standard Terms of Use
description:
Example of a tropical temperature trough over southern Africa; 850hPa analysis at 1200UTC and enhanced IR image at 1745UTC and 2 Nov 2006.
|
|

credits:
NOAA/NWS/CPC
copyright terms:
COMET Standard Terms of Use
description:
Monsoon Systems: OLR, 200hPa Streamlines, 850 hPa Wind Climatology (1979-1995) for the American, African, and Asian Australian Monsoons. Top panels are peak boreal summer monsoon, Bottom panels are peak austral summer monsoon. Small inset maps are digital elevation.
|

credits:
NRL
copyright terms:
COMET Standard Terms of Use
description:
Analysis of temperature, salinity, currents, and sea height produced by the Global Navy Coastal Ocean Model (NCOM).
|
|
|

credits:
NASA
copyright terms:
COMET Standard Terms of Use
description:
Monthly mean precipitation and convergence zones associated with the maxima
|
|

credits:
Adapted from Carbone et al. 2000
copyright terms:
COMET Standard Terms of Use
description:
schematic of the evolution of Hector
|

credits:
Wilson et al. 2001
copyright terms:
COMET Standard Terms of Use
description:
A radar reflectivity sequence showing the evolution of Hector. White lines indicate seabreeze boundaries, red lines are the outflow from the east coast convection and the green line the outflow boundary of the west coast convection.
|
view/save .swf file
credits:
Wilson et al. 2001
copyright terms:
COMET Standard Terms of Use
description:
A radar reflectivity sequence showing the evolution of Hector. White lines indicate seabreeze boundaries, red lines are the outflow from the east coast convection and the green line the outflow boundary of the west coast convection.
|

credits:
NOAA/NHC
copyright terms:
COMET Standard Terms of Use
description:
Operational GFS (orange) and GFS ensemble member (white) forecasts compared to the observed ?best track? (black) of Hurricane Ike (2008). In this case, the GFS ensemble average performs better than the deterministic (orange) GFS forecast
|

credits:
Jonathan Vigh
copyright terms:
COMET Standard Terms of Use
description:
120 hour forecasts of Hurricane Ophelia initialized at 6 hour intervals for the period 1200 UTC 7 September (top left) through 0600 UTC 9 September 2005 (bottom right) demonstrating the ?squashed spider? track guidance. During this time Ophelia executed a loop off the east coast of Florida (Beven et al. 2008). The forecast period spans the time of a subsequent loop off the Georgia and South Carolina coasts on 11-12 September. Official forecast is given in black; see the legend to identify the individual numerical models
|

credits:
NOAA/NHC
copyright terms:
COMET Standard Terms of Use
description:
Example of the GCPE forecast circles of the potential consensus track error. The example is for a 48 h consensus forecast of Hurricane Rita (2005) initialized at 0600 UTC on 22 September 2005
|
|

credits:
Jenni Evans
copyright terms:
COMET Standard Terms of Use
description:
Relative tracks of 1995 North Atlantic Hurricane Iris and Tropical Storm Karen as they undergo a Fujiwhara interaction with each other. Note how the direction of rotation changes from cyclonic to anticyclonic as Karen is eventually absorbed into Iris
|
|
|
|

credits:
Morrison and Businger 2001
copyright terms:
COMET Standard Terms of Use
description:
Sea-level pressure, isotherms, and satellite IR temperature (indicating deep convection and heavy precipitation) for a Kona Low: (a) 1800 UTC 23 Feb, (b) 1200 UTC 24 Feb, (c) 1200 UTC 25 Feb, (d) 1200 UTC 26 Feb, and (e) 1200 UTC 27 Feb 1997. From Morrison and Businger 2001
|

credits:
Adapted from RSMC La Reunion
copyright terms:
COMET Standard Terms of Use
description:
Example of track forecast verification for the La Reunion forecast office from the1990-1991 season through the 2007-2008 season
|

credits:
Jenni Evans
copyright terms:
COMET Standard Terms of Use
description:
Verification of multi-category forecasts of storm category frequency
|
|
|
|
|
|
|
|
|
|
view/save .swf file
credits:
Australian Bureau of Meteorology
copyright terms:
COMET Standard Terms of Use
description:
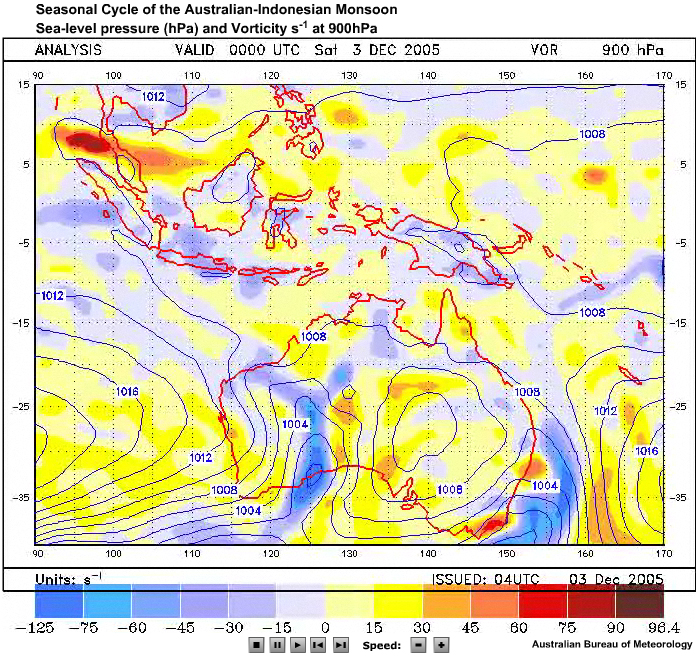
Animation of the seasonal cycle of the Australian-Indonesian monsoon (sea-level pressure and vorticity at 900hPa) from the Australian BOM TXLAPS system.
|

credits:
BOM
copyright terms:
COMET Standard Terms of Use
description:
The diurnal cycle of the number of cells per day with 45 dBz reflectivities for the active monsoon (left) and break monsoon (right) at Darwin.
|

credits:
Australian Bureau of Meteorology
copyright terms:
COMET Standard Terms of Use
description:
Schematic of active and break environments relative to the monsoon trough
|
|

credits:
Australian Bureau of Meteorology
copyright terms:
COMET Standard Terms of Use
description:
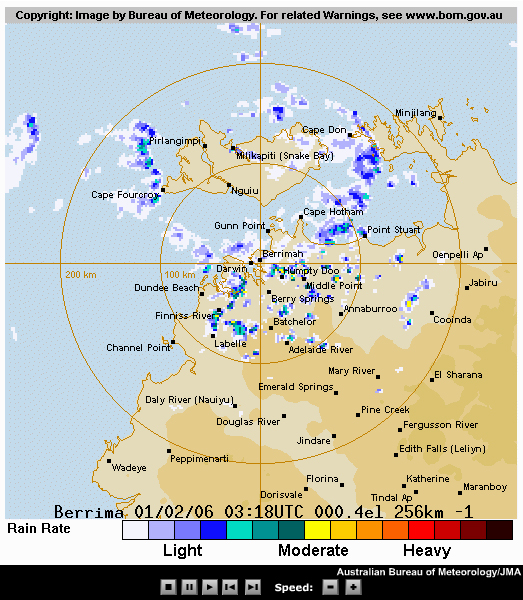
(a) Radar reflectivity image and (b) radiosonde ascent (bottom right) for 1 Feb 2006
|

credits:
Australian Bureau of Meteorology / The COMET Program
copyright terms:
COMET Standard Terms of Use
description:
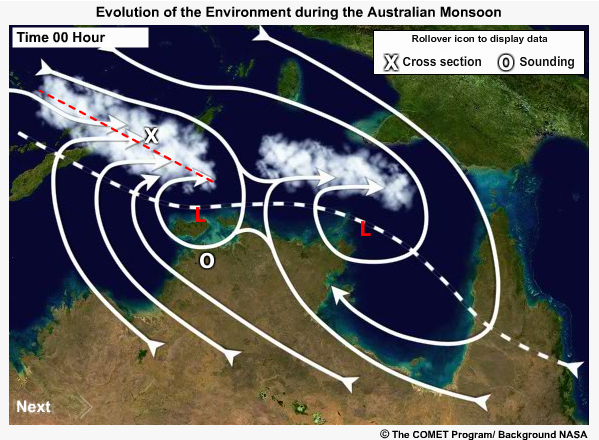
Conceptual map of the process and weather systems during the active, break, and suppressed regimes of the North Australian Monsoon
|

credits:
Dept Geography University of Oregon, March 2000
copyright terms:
COMET Standard Terms of Use
description:
Composites of sea level pressure and surface wind for January
|

credits:
Dept Geography University of Oregon, March 2000
copyright terms:
COMET Standard Terms of Use
description:
Composites of sea level pressure and surface wind for July
|
|

credits:
Comet/NOAA
copyright terms:
COMET Standard Terms of Use
description:
Trajectories from the HYSPLIT model (a) typical output (m above ground level or AGL) and (b) projected in Google Earth
|
|

credits:
Zilore Mumba / ACMAD
copyright terms:
COMET Standard Terms of Use
description:
(a) Model analysis of 850 hPa winds and enhanced satellite IR image, (b) synthetic analysis for 1 Nov 2006.
|

credits:
NOAA/NWS
copyright terms:
COMET Standard Terms of Use
description:
Velocity Azimuthal Display (VAD) from NWS Doppler radar at Jacksonville, Florida on 17 Jun 1998
|

credits:
Ebert 2001
copyright terms:
COMET Standard Terms of Use
description:
Schematic of object-oriented spatial verification. The spatial extent (heavy line) of the system in question is defined via a pre-determined threshold and contouring highlights the spatial distributions of significant threshold values
|

credits:
NOAA/NWS/NCEP
copyright terms:
COMET Standard Terms of Use
description:
Fraction of data ingested into the NCEP global modeling system
|

credits:
NOAA
copyright terms:
COMET Standard Terms of Use
description:
NHC best track for Hurricane Ophelia (2005). Loops off the Florida, Georgia and South Carolina coasts resulted in widely divergent operational forecast model track forecasts
|
|

credits:
(c) The COMET Program
copyright terms:
COMET Standard Terms of Use
description:
Flow relative to terrain over Papua New Guinea during trade wind flow, May to August, and monsoonal flow, January to April. Yellow and white arrows show prevailing flow and point to general locations of rainfall maxima during the trade wind and monsoon season, respectively.
|
|

credits:
Laing 2004
copyright terms:
COMET Standard Terms of Use
description:
Specific humidity (g kg-1; shaded) and vertical velocity (Pa s-1; lines). Bold vertical lines mark the longitude of Puerto Rico
|

credits:
Laing 2004
copyright terms:
COMET Standard Terms of Use
description:
Enhanced satellite IR (GOES-MB) images of flash flood producing system over Puerto Rico
|

credits:
Laing 2004
copyright terms:
COMET Standard Terms of Use
description:
Specific humidity (g kg-1; shaded) and vertical velocity (Pa s-1; lines). Bold vertical lines mark the longitude of Puerto Rico
|

credits:
Laing 2004
copyright terms:
COMET Standard Terms of Use
description:
Cold front and prefrontal trough that produced heavy rainfall (200-300mm in most areas and 500mm at a few stations) and flash flooding in Puerto Rico
|
|

credits:
Earle Williams
copyright terms:
COMET Standard Terms of Use
description:
Radar reflectivity: (a,b) PPI at 0.7° elevation and (c,d) RHI over Niamey, Niger
|
|
|

credits:
NOAA/NWS San Juan
copyright terms:
COMET Standard Terms of Use
description:
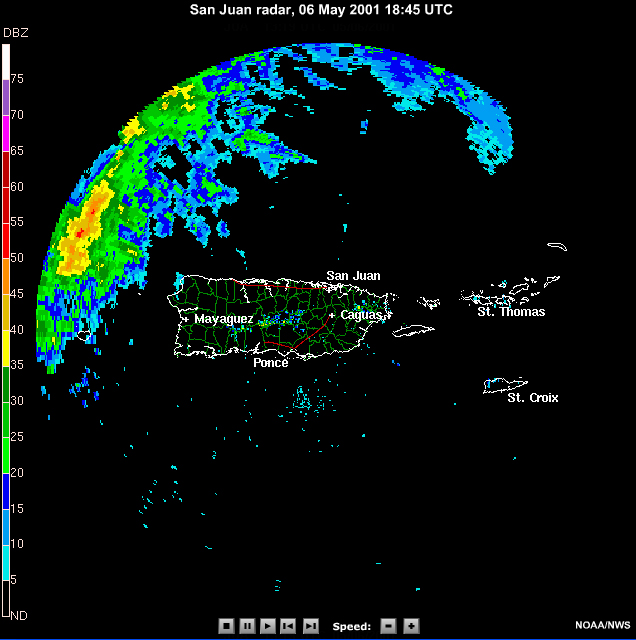
Radar reflectivity of convection over Puerto Rico and vicinity, 6 May 2001
|

credits:
Rappaport et al. 2008 Ncar/EOL
copyright terms:
COMET Standard Terms of Use
description:
Improvement in tropical cyclone track forecast accuracy from the GFS model due to dropwindsonde data from synoptic surveillance missions during the period 1999?2005. Improvement is expressed as a percentage relative to the error in a set of parallel forecasts made without the dropwindsonde data (solid line). The number of cases is shown by the dashed line.
|

credits:
Australian Bureau of Meteorology
copyright terms:
COMET Standard Terms of Use
description:
the Doppler velocity image of a squall line 9 minutes prior to damaging winds being observed near the surface
|

credits:
NOAA
copyright terms:
COMET Standard Terms of Use
description:
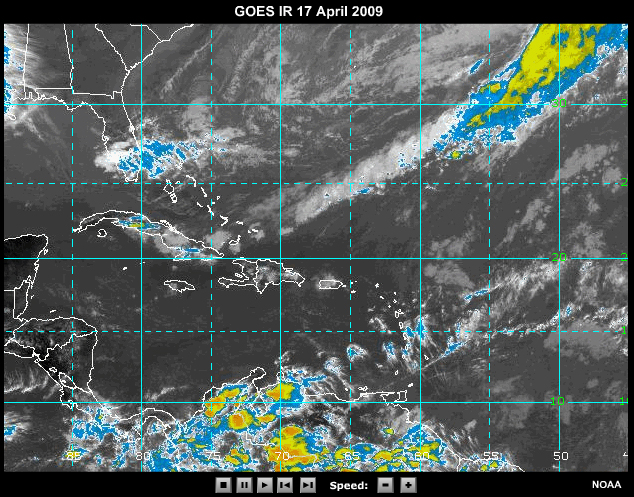
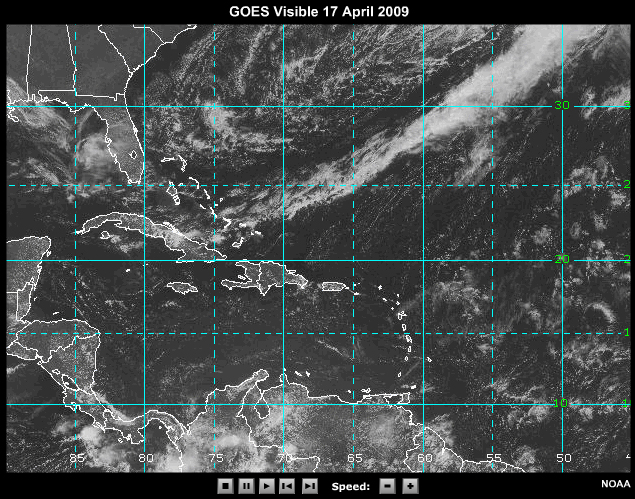
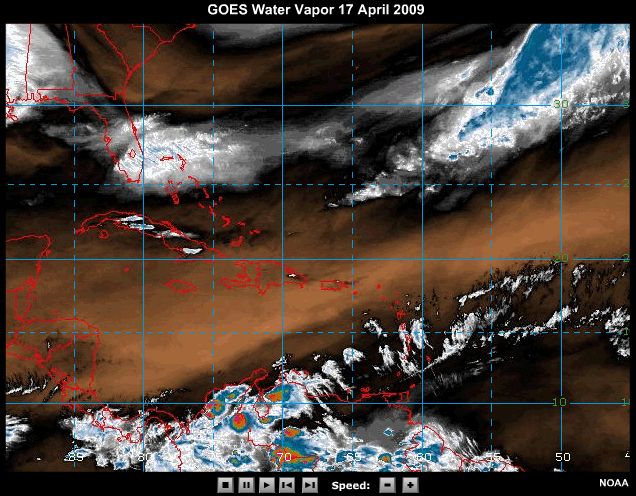
Sequence of visible satellite images (a, c, e) and concurrent water vapor imagery (b, d, f) with cloud motion winds on 17 April 2009
|
|
|
|

credits:
NOAA/NWS/NCEP
copyright terms:
COMET Standard Terms of Use
description:
Ensemble mean and spread of 850hPa temperature valid at 00 UTC 5 Aug 2009
|

credits:
NOAA/NWS/NCEP
copyright terms:
COMET Standard Terms of Use
description:
a) Spaghetti plot of the 24 h GEFS forecasts for the 1012 hPa isobar and (b) the analysis of mean sea level pressure, 10 m winds, and 2 m temperature.
|

credits:
ECMWF
copyright terms:
COMET Standard Terms of Use
description:
Graphs showing satellite observing system and data volume increase from 1996 to 2009
|

credits:
US Navy/NRL/(c)EUMETSAT 2008
copyright terms:
COMET Standard Terms of Use
description:
Accumulated precipitated estimates from blended satellite microwave and IR measurements, (a) 3-hr accumulation (b) 12-hr accumulation
|
|
|
|

credits:
NOAA/NESDIS US Navy EUMETSAT 2008
copyright terms:
COMET Standard Terms of Use
description:
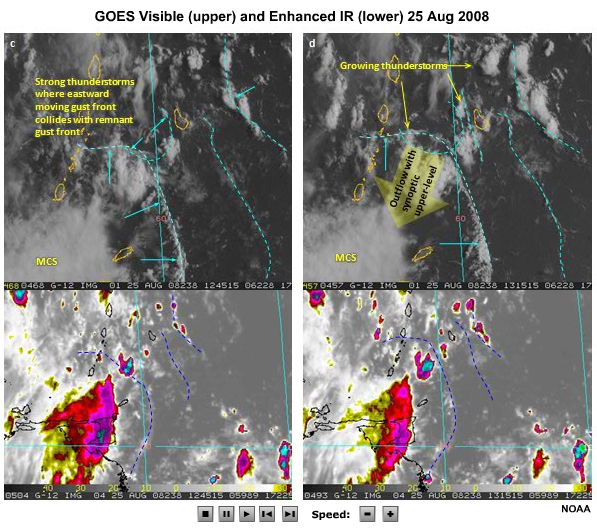
(a) Combined visible and IR image and synoptic scale sea level pressure analysis; (b) enhanced satellite IR showing mesoscale convective system, (c) 1-km visible image showing convective scale cloud lines and thunderstorm outflow boundary or gust front at 1215 UTC 25 Aug 2008.
|

credits:
NOAA
copyright terms:
COMET Standard Terms of Use
description:
Surface winds and visible satellite image at 1200UTC 25 Aug 2008. Magenta lines mark confluence southeastern Caribbean. Double orange line marks the ITCZ
|

credits:
NOAA/US Navy/NRL
copyright terms:
COMET Standard Terms of Use
description:
Surface winds and visible satellite image at 1200UTC 25 Aug 2008. Magenta lines mark confluence southeastern Caribbean. Double orange line marks the ITCZ
|

credits:
COMET /Australian BOM
copyright terms:
COMET Standard Terms of Use
description:
(a) Structure of an initially developing break period continental squall line. . (b) A 2300 UTC sounding at Darwin showing the wind, temperature and moisture profile typical of a break period continental squall line.
|

credits:
NOAA/NWS/NCEP/CPC
copyright terms:
COMET Standard Terms of Use
description:
Radar reflectivity at 1845UTC on 6 May 2001 from San Juan NWS Doppler Radar.
|
|

credits:
COMET
copyright terms:
COMET Standard Terms of Use
description:
Schematic of TC motion resulting from the combination of steering and propagation in easterlies and westerlies in both the Northern and Southern Hemispheres
|

credits:
Adapted from Douglas 1992
copyright terms:
COMET Standard Terms of Use
description:
Streamlines and isotachs at 1200 UTC 8 July 1979 at (a) 850 hPa, (b), 500hPa, (c) 300 hPa. Black dot is position of surface center. (d) DMSP visible image at 0600 UTC 8 July and layer mean temperature for 800-700 hPa (white lines) and 500-300 hPa(black).
|
|
|

credits:
Australian Bureau of Meteorology/JMA
copyright terms:
COMET Standard Terms of Use
description:
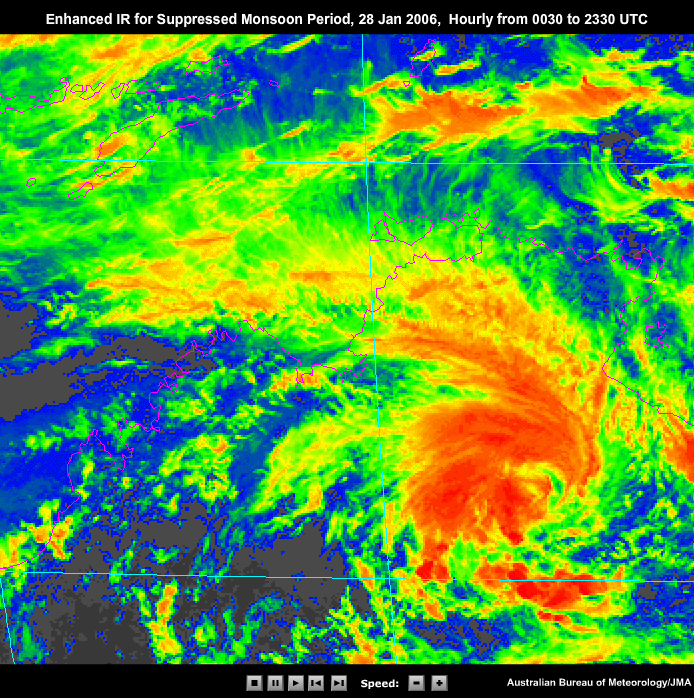
(a) IR satellite image for 1000 LST, (b) BoM model analysis of MSLP and 900 hPa vorticity and (c) 0000 UTC Darwin sounding for a suppressed phase of the monsoon,28 January 2006. (d) Sample radar images of a suppressed monsoon phase.
The suppressed monsoon over Darwin is due to a deep low over central Australia (Fig. 11F1.11). Such deep lows are referred to colloquially as ?landfoons?. The MSLP/vorticity chart shows that the monsoon trough is well to the south of Darwin, together with the associated convergence. The flow is southwesterly rather than west to northwesterly flow associated with an active monsoon.
|
|

credits:
Zilore Mumba / ACMAD
copyright terms:
COMET Standard Terms of Use
description:
Example of weather analysis systems: ?Synergie? used by many national meteorological centers in Africa and other former French colonies.
|
|

credits:
(c) The COMET Program/WMO
copyright terms:
COMET Standard Terms of Use
description:
Percentage of SYNOP reports received during the 2004 to 2008 October AGM in comparison with the numbers of reports required from the RBSN stations
|

credits:
Merrill 1998
copyright terms:
COMET Standard Terms of Use
description:
Schematic of the upper tropospheric factors affecting tropical cyclone intensity change.
|

credits:
US Navy NRL / NASA / NOAA
copyright terms:
COMET Standard Terms of Use
description:
Total precipitable water (TPW) 12-hour accumulation and 850 hPa Winds from the NOGAPS global model for (a)1200 UTC 9 Nov and (b) 1200 UTC 11 Nov. 2009
|

credits:
NOAA/NWS/NCEP/ US Navy/NRL/NASA/NOAA
copyright terms:
COMET Standard Terms of Use
description:
850 hPa GFS model analysis (a,b) and total precipitable water and NOGAPS model winds (c,d) on 13 and 15 November, respectively; showing tropical cyclogenesis from a mixed Rossby-gravity wave
|

credits:
NOAA/NWS
copyright terms:
COMET Standard Terms of Use
description:
Comparison of track forecast skill for consensus (GUNA, CONU, FSSE) and dynamical forecast (GFSI,7 GFDI, GFNI, UKMI and NGPI) models and the official NHC forecast (OFCL). The dynamical models plotted are the member models used in forming the consensus forecasts.
|

credits:
NOAA/NWS
copyright terms:
COMET Standard Terms of Use
description:
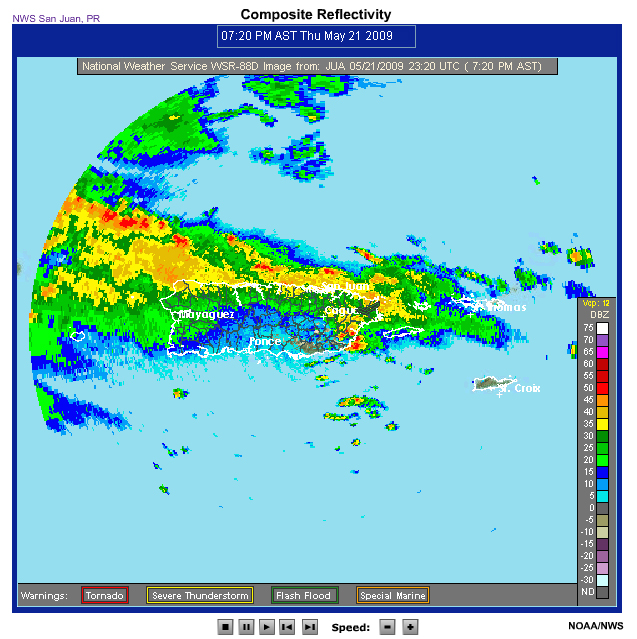
Composite reflectivity dBz, images from NWS WRS-88D radar in San Juan, Puerto Rico
|

credits:
NOAA/NWS
copyright terms:
COMET Standard Terms of Use
description:
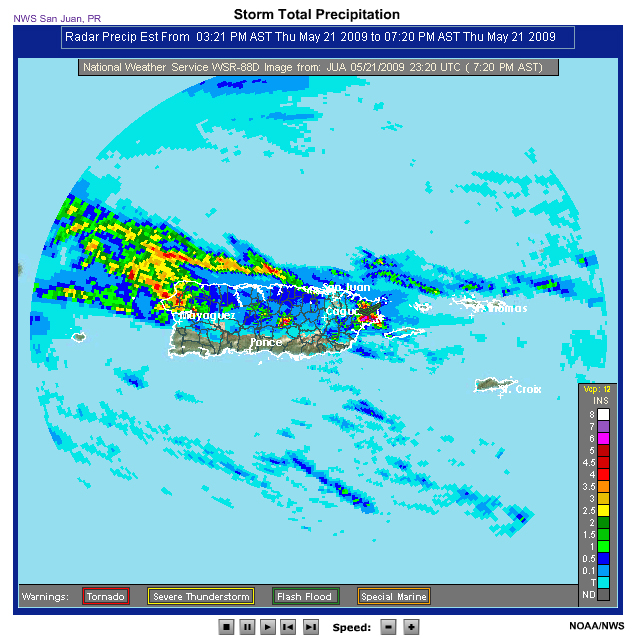
storm total precipitation (inches), images from NWS WRS-88D radar in San Juan, Puerto Rico
|

credits:
Kodama and Businger 1998
copyright terms:
COMET Standard Terms of Use
description:
Conceptual diagram of four types of synoptic-scale systems that affect the tropics. Solid lines show surface isobars; shaded arrows depict surface flow. Bold streamlines in (c) illustrate 200-hPa flow. Solid arrow in (d) is the tropical cyclone track .
|
|
|
|

credits:
COMET
copyright terms:
COMET Standard Terms of Use
description:
Schematic of ensemble mean and spread: c) one-sided spread maximum indicates clustering of ensemble forecasts that are different from the mean.
|

credits:
COMET
copyright terms:
COMET Standard Terms of Use
description:
Schematic of ensemble mean and spread: (a) Spread maximum at the trough indicates amplitude uncertainty
|

credits:
COMET
copyright terms:
COMET Standard Terms of Use
description:
Schematic of ensemble mean and spread: (b) spread maxima on either side of the trough indicate phase uncertainty or difference in position of the trough among ensemble members,
|

credits:
Tuleya et al. 2007
copyright terms:
COMET Standard Terms of Use
description:
Verification of storm total rainfall forecasts for Hurricane Fran (1996) for the period from 1200 UTC 9 Sep to 1200 UTC 12 Sep. (a) Observed totals from rain gauges over the 72 h period;
|

credits:
May et. al. 2008
copyright terms:
COMET Standard Terms of Use
description:
Rainfall accumulation averaged over the 300-km-diameter circle sampled with the polarimetric Radar during TWP-ICE. The heavy vertical lines mark the beginning and end of the intensive observing period and dotted lines are regime transitions. May et al. 2008.
|

credits:
May et. al. 2008
copyright terms:
COMET Standard Terms of Use
description:
The derived mean vertical motion (left) and cloud frequency from the Millimeter Cloud Radar (MMRC; right) that correspond to the different observed monsoon regimes during TWP-ICE
|

credits:
NOAA/NWS/ NCEP/CPC
copyright terms:
COMET Standard Terms of Use
description:
Velocity Potential Anomalies and Enhanced Satellite IR images for global tropics, 26-29 Sep 2008
|

credits:
US Navy/NRL
copyright terms:
COMET Standard Terms of Use
description:
Number of verified forecasts from the 2001-2007 seasons. The GCPE was developed on a training dataset of these data from the 2002-2006 seasons
|

credits:
COMET
copyright terms:
COMET Standard Terms of Use
description:
Schematic of the impact of vertical wind shear on the steering flow for two TC of different intensity.
|
|

credits:
Australia BOM /(c)The COMET Program
copyright terms:
COMET Standard Terms of Use
description:
. A schematic (left) and sounding (right) for a wet microburst.
|

credits:
US Navy NRL / NASA / NOAA
copyright terms:
COMET Standard Terms of Use
description:
GOES images of Hurricane Wilma (2005) show its rapid intensification over nine hours, from 975 hPa to 882 hPa. Wilma intensified from a tropical storm to a Category 5 hurricane in 24 hours!
|

credits:
Drosdowsky 1996
copyright terms:
COMET Standard Terms of Use
description:
Mean daily zonal winds and precipitation at Darwin, Australia.
|
|