The following media items used in this module are protected by the details of their copyrights. Please use the "copyright terms" link associated with each media item below for more information.
Click an image to view it at full size in a new browser window/tab.
|
|

credits:
Australian Bureau of Meteorology/JMA
copyright terms:
COMET Standard Terms of Use
description:
The enhanced IR satellite image of an equatorial mixed Rossby-gravity wave at 0000 UTC 21 November 2002 illustrates the impact of the convection on the wave structure. Satellite image originally processed by the Bureau of Meteorology from the geostationary satellite GMS-5 operated by the Japan Meteorological Agency.
|

credits:
Australian Bureau of Meteorology/JMA
copyright terms:
COMET Standard Terms of Use
description:
Enhanced IR satellite image corresponding to the 850hPa tropical wind analysis for 1200 UTC 7 October. 2002, pictured in Fig. 5.16. Satellite image originally processed by the Bureau of Meteorology from the geostationary satellite GMS-5 operated by the Japan Meteorological Agency
|

credits:
COMET
copyright terms:
COMET Standard Terms of Use
description:
Adjustments based on size relative to the Rossby radius of deformation, LR .
|

credits:
Australian Bureau of Meteorology
copyright terms:
COMET Standard Terms of Use
description:
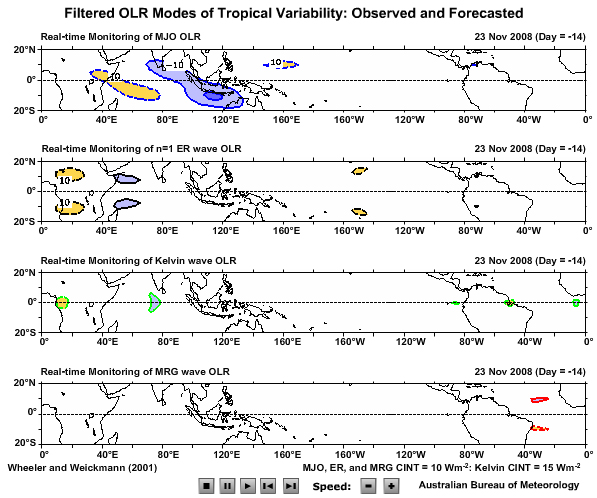
Maps of (a) all OLR anomalies after the annual cycle has been removed and OLR anomalies associated with (b) n=1 ER, (c) Kelvin, (d), MRG waves. Blue shading indicates enhanced convection and rainfall while orange shading indicates suppressed conditions.
|

credits:
Australian Bureau of Meteorology
copyright terms:
COMET Standard Terms of Use
description:
Plots of (a) OLR anomalies associated with the MJO and (b) all OLR anomalies after the annual cycle has been removed.
|

credits:
NOAA/AOML
copyright terms:
COMET Standard Terms of Use
description:
Paths of Atlantic hurricanes during (a) the AMO cold phase and (b) the AMO warm phase.
|

credits:
NOAA/AOML
copyright terms:
COMET Standard Terms of Use
description:
(a) Typical wintertime SST (colors), sea level pressure (contours), and surface windstress (arrows) anomaly during warm and cool phases of PDO. (b) Monthly PDO index from 1925 to Sep 2006
|

credits:
Australian Bureau of Meteorology
copyright terms:
COMET Standard Terms of Use
description:
Maps of Kelvin waves; the first three maps are for the most recent three days of observed data and subsequent maps are the forecasts of the wave OLR anomalies produced by the real-time filtering technique
|

credits:
Australian Bureau of Meteorology
copyright terms:
COMET Standard Terms of Use
description:
Maps of n=1 ER waves; the first map is the observed waves and the second map is the forecasted waves. Blue shading is an indication of enhanced convection and rainfall while orange shading is an indication of suppressed conditions.
|
|

credits:
Magana et. al. 2003
copyright terms:
COMET Standard Terms of Use
description:
Summer (JJAS) Rainfall over Central America and the Caribbean during (a) El Niño and (b) La Niña.
|

credits:
NOAA/PMEL/TAO Project Office
copyright terms:
COMET Standard Terms of Use
description:
El Nino conditions December 1997, Sea Surface Temp in degree Celcius
|
|

credits:
International Research Institute for Climate and Society
copyright terms:
COMET Standard Terms of Use
description:
Time evolution for the idealized experimental waves generated in Fig. 5.27 (IRI).
|

credits:
International Research Institute for Climate and Society
copyright terms:
COMET Standard Terms of Use
description:
Idealized model of a single equatorial eastward-moving Kelvin wave generated by wind stress anomaly (red and orange) and corresponding Rossby waves propagating westward.
|

credits:
NOAA/NCEP/CPC
copyright terms:
COMET Standard Terms of Use
description:
SST mean and anomalies for (a) a strong El Niño and (b) as strong La Niña.
|

credits:
NOAA/PEAC
copyright terms:
COMET Standard Terms of Use
description:
Tropical cyclone activity in the Atlantic (upper) and East Pacific (lower) the year before, during, and after El Niño.
|
|

credits:
UCAR
copyright terms:
COMET Standard Terms of Use
description:
The geographic and seasonal distribution of large-scale precipitation anomalies associated with ENSO.
|

credits:
LaJoie and Laing 2008
copyright terms:
COMET Standard Terms of Use
description:
DJF lightning flash density (km2) for (a) 199798 El Niño and (b) 20002001 La Niña. Adapted from LaJoie and Laing (2008)
|
|

credits:
(c) The COMET Program
copyright terms:
COMET Standard Terms of Use
description:
Schematic depiction of the theoretical solution for an equatorial kelvin wave in a dry, incompressible atmosphere.
|
|
|
|

view/save .swf file
credits:
COMET
copyright terms:
COMET Standard Terms of Use
description:
Schematic depiction of the theoretical solution for an equatorial Rossby wave in a dry, incompressible atmosphere. Only one wavelength is drawn here.
|
credits:
(c) The COMET Program
copyright terms:
COMET Standard Terms of Use
description:
Schematic depiction of the theoretical solution for an equatorial Rossby wave in a dry, incompressible atmosphere. Only one wavelength is drawn here.
|

credits:
Australian Bureau of Meteorology
copyright terms:
COMET Standard Terms of Use
description:
Evidence of equatorial Rossby waves in the Australian Bureau of Meteorology (BOM) 850hPa tropical wind analysis for 7 October 2002, 12 UTC.
|

credits:
Paul Roundy
copyright terms:
COMET Standard Terms of Use
description:
Distribution of annual mean variance of IR brightness temperature filtered for the (a) Kelvin, (b) n = 1 ER, and (c) MRG. Also shown are preferred direction of propagation and preferred location of tropical cyclone genesis associated with each mode (courtesy of Paul Roundy).
|
|

credits:
NOAA/CPC/NCEP/NWS
copyright terms:
COMET Standard Terms of Use
description:
Global pattern of MJO impacts during Boreal summer (JJA). Impacts identified are: (1) alternating periods of wetter and drier conditions in the tropics; (2) modulation of the monsoons; and (3) modulation of tropical cyclone activity
|

credits:
NOAA/CPC/NCEP/NWS
copyright terms:
COMET Standard Terms of Use
description:
Global pattern of MJO impacts during Boreal winter (DJF): (1) alternate periods of wetter and drier conditions; (2) extension of a tropical moisture plume (the ?Pineapple Express?) into higher latitudes, feeding heavy midlatitude rainfall events; (3) modulation of monsoon systems; (4) modulation of tropical cyclone activity; and (5) modulation of ENSO through oceanic Kelvin waves.
|

credits:
Australian Bureau of Meteorology
copyright terms:
COMET Standard Terms of Use
description:
Demonstrating the peak in MJO in the Indian Ocean and western Pacific and the weaker MJO signal in the central and eastern Pacific.
|

credits:
NOAA/NWS/CPC
copyright terms:
COMET Standard Terms of Use
description:
Part of an MJO cycle indicated by cloud top IR temperatures and velocity potential anomalies at 200 hPa.
|

credits:
NOAA/PMEL
copyright terms:
COMET Standard Terms of Use
description:
The onset of the 1997-98 El Niño marked by downwelling equatorial Kelvin waves triggered by westerly wind bursts.
|

credits:
Wang and Fu 2005
copyright terms:
COMET Standard Terms of Use
description:
Composite of 200 hPa height (contour), wind (vector) and precipitation (shading) anomalies. Top left shows the theoretical Kelvin wave derived by Matsuno (1966).
|

credits:
NOAA/PMEL
copyright terms:
COMET Standard Terms of Use
description:
Sample display of real-time observations of SST means and anomalies from the array.
|

credits:
as on graphic
copyright terms:
COMET Standard Terms of Use
description:
Time series of the Mulitvaraite ENSO Index (MEI). The anomalies are relative to the reference period 1950-93
|

credits:
COMET
copyright terms:
COMET Standard Terms of Use
description:
Schematic depiction of the theoretical solution for a mixed Rossby-gravity wave in a dry, incompressible atmosphere (upper) and with moist convection (lower).
|

credits:
Maloney and Hartmann 2000
copyright terms:
COMET Standard Terms of Use
description:
Analysis of the impact of the MJO on eastern Pacific and western Atlantic tropical cyclone activity on 850 hPa wind anomalies and tropical cyclone tracks. (a) and (b) 850 hPa wind anomalies for (A) positive (westerly) and (B) negative (easterly) MJO phases.
|

credits:
Madden and Julian 1972
copyright terms:
COMET Standard Terms of Use
description:
Repeat of the MJO schematic from Fig. 5.3 of the longitudinal progression of the MJO across the tropical Indian and Pacific Oceans. Correspondence between the observed MJO and the spatial structures corresponding to the EOFs discussed above is indicated to the right of the image.
|

credits:
Madden and Julian, 1972
copyright terms:
COMET Standard Terms of Use
description:
Schematic depiction of the longitudinal progression of the MJO across the tropical Indian and Pacific Oceans. Time progresses downwards at roughly 5 day intervals.
|

credits:
Rui and Wang 1990
copyright terms:
COMET Standard Terms of Use
description:
Schematic depiction of the large-scale wind structure of the MJO. The cloud symbol indicates the convective center. Arrows represent anomalous winds at 850 and 200 hPa and the vertical motions at 500 hPa. ?A? and ?C? mark the anticyclonic and cyclonic circulation centers, respectively. Dashed lines mark troughs and ridges.
|

credits:
Rasmusson and Arkin 1993
copyright terms:
COMET Standard Terms of Use
description:
Schematic of the major modes of tropical variability.
|

credits:
Nakazawa 1988
copyright terms:
COMET Standard Terms of Use
description:
Schematic depicting intraseasonal variability (ISV; slanting ellipses) of large-scale cloud complexes. Super cloud clusters (SCC; slanting heavy lines) propagate within the ISV. Both the ISV and the SCC propagate eastwards. The inset on the right of the figure depicts the finer scale structure of the SCC. Cloud clusters on the scale of a few hundred to 1000 km propagate westwards within the SCC. These cloud clusters develop, mature and decay in a few days
|
|
|
|
|
|

credits:
NOAA/NCEP/CPC
copyright terms:
COMET Standard Terms of Use
description:
Schematic of upper ocean and atmospheric circulation during the (b) La Niña extremes.
|

credits:
NOAA/NCEP/CPC
copyright terms:
COMET Standard Terms of Use
description:
Schematic of upper ocean and atmospheric circulation during the (a) El Niño
|

credits:
NOAA/NCEP/CPC
copyright terms:
COMET Standard Terms of Use
description:
Regions of the equatorial Pacific for which ENSO SST anomalies are monitored. The numbers designated regional shipping lanes when ships were the primary sources of SST data.
|

credits:
NOAA/PMEL
copyright terms:
COMET Standard Terms of Use
description:
SST and water temperature profile in the Equatorial Pacific Ocean illustrate how the upper ocean changes during the transition from normal to El Niño to the development stage of El Niña.
|

credits:
University Corporation for Atmospheric Research
copyright terms:
COMET Standard Terms of Use
description:
Schematics of the Pacific Walker Circulation.
|

credits:
see instructions
copyright terms:
COMET Standard Terms of Use
description:
(a) Typical wintertime SST (colors), sea level pressure (contours), and surface windstress (arrows) anomaly during warm and cool phases of PDO. (b) Monthly PDO index from 1925 to Sep 2006
|

credits:
NOAA/CPC/NCEP/NWS
copyright terms:
COMET Standard Terms of Use
description:
Link of the passage of the MJO across the Pacific to development of intense wintertime precipitation in western North America.
|

credits:
Hagemeyer 2006
copyright terms:
COMET Standard Terms of Use
description:
Composite daily mean sea level pressure (hPa) during extreme El Niño conditions,February 1998, and extreme La Niña, February 1989
|

credits:
Paul Roundy
copyright terms:
COMET Standard Terms of Use
description:
Hovmöller diagram of tropical wave progression in time around the equator
|
|

credits:
University Corporation for Atmospheric Research
copyright terms:
COMET Standard Terms of Use
description:
An illustration of the problems and uncertainties in determining impacts of ENSO.
|

credits:
Adapted from Plumb 1977
copyright terms:
COMET Standard Terms of Use
description:
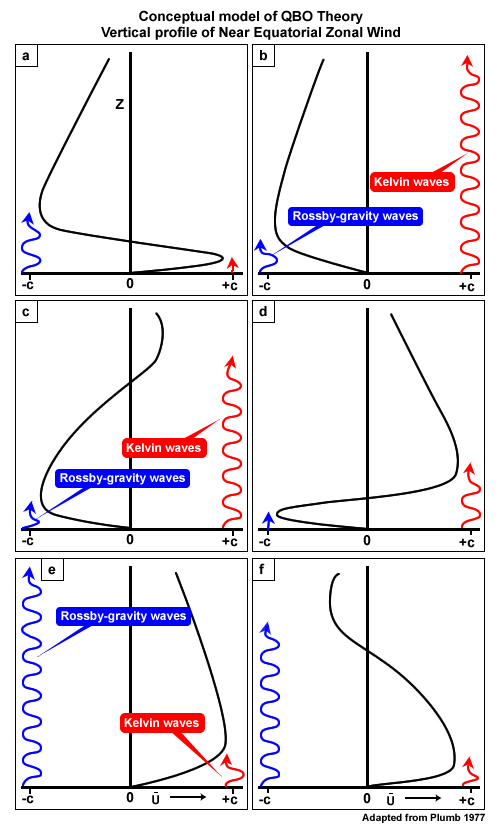
Schematic of the relationship of Kelvin waves and Rossby-gravity waves in the equatorial zone. In all of the diagrams in this figure, the black line shows the vertical profile of the near equatorial zonal wind (westerlies are positive) in the upper troposphere and lower stratosphere. The Kelvin waves (red) are propagating upwards through the atmosphere transporting westerly momentum. The Rossby-gravity waves (blue) are also propagating upwards, taking easterly momentum with them.
|

credits:
Plumb 1977
copyright terms:
COMET Standard Terms of Use
description:
Schematic of the relationship of Kelvin waves and Rossby-gravity waves in the equatorial zone. In all of the diagrams in this figure, the black line shows the vertical profile of the near equatorial zonal wind (westerlies are positive) in the upper troposphere and lower stratosphere. The Kelvin waves (red) are propagating upwards through the atmosphere transporting westerly momentum. The Rossby-gravity waves (blue) are also propagating upwards, taking easterly momentum with them.
|
credits:
copyright terms:
COMET Standard Terms of Use
description:
Schematic of the relationship of Kelvin waves and Rossby-gravity waves in the equatorial zone. In all of the diagrams in this figure, the black line shows the vertical profile of the near equatorial zonal wind (westerlies are positive) in the upper troposphere and lower stratosphere. The Kelvin waves (red) are propagating upwards through the atmosphere transporting westerly momentum. The Rossby-gravity waves (blue) are also propagating upwards, taking easterly momentum with them.
|

credits:
Baldwin et al. 2001
copyright terms:
COMET Standard Terms of Use
description:
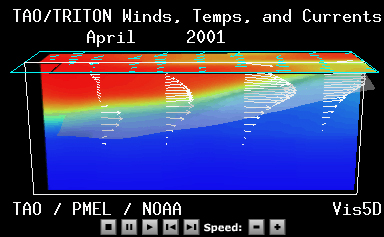
Time-height cross-section of the equatorial zonal-mean zonal winds simulated by Takahashi. Westerly (red) and easterly (blue) winds have 6 m s-1 contour interval.
|

credits:
Baldwin et al. 2001
copyright terms:
COMET Standard Terms of Use
description:
Fifty year (1953-2002) time history of the QBO. The index plotted is constructed from observed 30 hPa zonal winds from three near-equatorial stations: Canton Island, the Maldives, and Singapore. Westerly (red) and easterly (blue) winds highlight the approximately two year cycle (vertical lines indicate January for each year).
|

credits:
Andrew Heaps
copyright terms:
COMET Standard Terms of Use
description:
Latitude-time plots of zonally-averaged zonal winds at (a) 10 hPa and (b) 100 hPa. The QBO is evident in the alternating easterlies (blue/green) and westerlies (orange/red) along the equator. Data plotted are from the UKMO assimilated dataset which incorporates satellite and balloon observations.
|
credits:
Yang et al. 2003
copyright terms:
COMET Standard Terms of Use
description:
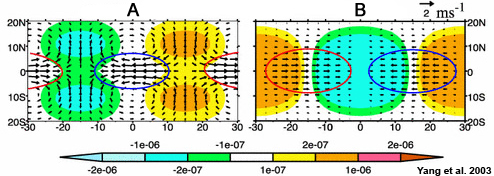
Schematic of theoretical Kelvin and equatorial Rossby waves
|
credits:
Yang et al. 2003
copyright terms:
COMET Standard Terms of Use
description:
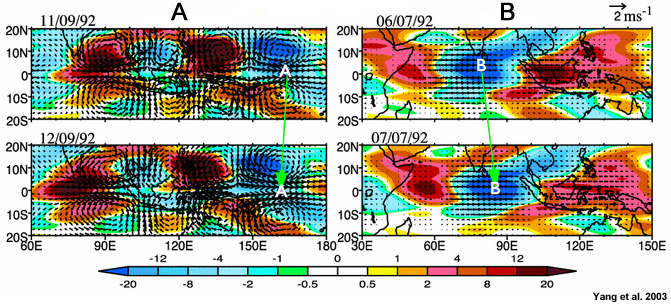
Image of Kelvin and equatorial Rossby waves indicated by divergence, wind vectors at 850hPA
|

credits:
Meinen and McPhaden 2002
copyright terms:
COMET Standard Terms of Use
description:
Schematic of ocean transport based on the recharge/discharge theory of ENSO
|

credits:
Roundy and Frank 2004
copyright terms:
COMET Standard Terms of Use
description:
Wavenumber-frequency diagram illustrating the spectral bands used to filter OLR data to identify real-world equatorial waves. The solid lines indicate the filters imposed by Roundy and Frank, while the dotted lines define the filter boundaries imposed by Wheeler and Kiladis.
|

credits:
NOAA/PMEL
copyright terms:
COMET Standard Terms of Use
description:
Time series of the Southern Oscillation Index and SST Anomalies in the Equatorial Pacific Ocean.
|

credits:
Larkin and Harrison 2002
copyright terms:
COMET Standard Terms of Use
description:
Longitude?time plots of anomalies of (a) SST (SSTA, °C), (b) normalized sea level pressure (SLPA, hPa). Top panels are El Niño composite, middle panels are La Niña (anomaly multiplied by -1) composite, and the difference between the two (warm?cold anomaly). The El Niño composite consisted of 1951, 1953, 1957, 1965, 1972, 1976, 1982, 1987, 1991. La Niña composite consisted of 1949, 1950, 1954, 1955, 1964, 1970, 1973, 1975, 1988.
|
|
|

credits:
International Research Institute for Climate and Society
copyright terms:
COMET Standard Terms of Use
description:
SST anomalies through (a) warm event cycles and (b) cold event cycles.
|

credits:
International Research Institute for Climate and Society
copyright terms:
COMET Standard Terms of Use
description:
Forecasts of SST anomalies for the Niño 3.4 region from (a) dynamical models and (b) statistical models (courtesy of IRI).
|
|
|

credits:
(c) UCAR
copyright terms:
COMET Standard Terms of Use
description:
Demonstration of secondary circulation that leads to a dip in the center of fluid stirred in a cup
|
|
|

credits:
McBride and Frank 1999
copyright terms:
COMET Standard Terms of Use
description:
Vertical profiles of equivalent potential temperature (θe) for two active convection periods in the Australian summer monsoon (short- and long-dashed lines), and a break (inactive convection) period (solid line). Measurements are upper air soundings taken from the ship located in the Gulf of Carpentaria during the AMEX field experiment
|

credits:
NOAA/PMEL
copyright terms:
COMET Standard Terms of Use
description:
The Trans Pacific Profiler Network of wind profilers established in 1984.
|

credits:
NOAA/ESRL/PSD
copyright terms:
COMET Standard Terms of Use
description:
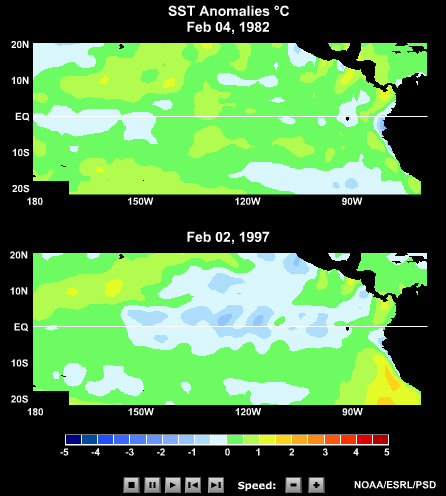
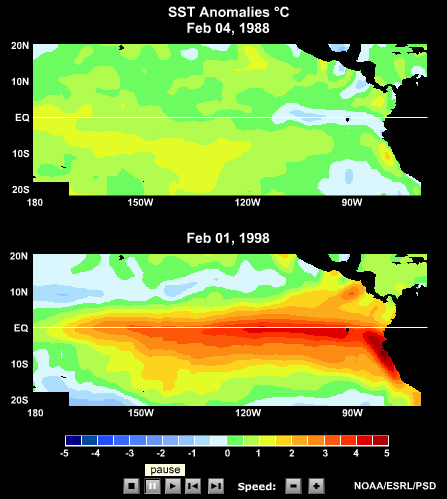
Comparison of SST anomalies during (left) two strong El Niño events and (right) two strong La Niña events.
|

credits:
Larkin and Harrison 2002
copyright terms:
COMET Standard Terms of Use
description:
Longitude-time plots of the composite El Nino and La Nina events for (a) zonal wind (UA m s-1) and (b) meridional wind (VA, m s-1). The zonal wind anomaly is taken along the equator. The meridional wind anomaly plot is at 6°N where the amplitude is typically largest.
|

credits:
Chanzai Wang
copyright terms:
COMET Standard Terms of Use
description:
Conceptual model of the western Pacific oscillator theory of ENSO
|

credits:
Wheeler and Hendon 2004
copyright terms:
COMET Standard Terms of Use
description:
Boreal winter (DJF) composite OLR and 850 hPa vector wind anomalies. Hatching (shading) levels denote OLR anomalies greater (less) than positive (negative) 7.5, 15, 22.5 and 30 W m-2 respectively. Statistically significant vector wind anomalies are plotted. The magnitude of the largest vector varies between panels and is shown on the bottom right of each panel
|

credits:
Wheeler and Hendon 2004, CAWCR/BOM
copyright terms:
COMET Standard Terms of Use
description:
Plots of (a) OLR anomalies associated with the MJO and (b) all OLR anomalies after the annual cycle has been removed. Available from the Australia Bureau of Meteorology.
|